


Data visualization to make informed decisions is more important than ever. That’s why our team has continued to break the mold and go beyond traditional analytics—supporting our retail and QSR clients to see and fix frontline issues.
Gone are the days of complicated dashboards, confusing metrics, and inconsistent data. We’re excited to announce a leap forward in frontline operational analytics innovation: SimpliField’s New Advanced Analytics.
By bolstering the leading SimpliField retail performance platform with upgraded Standard Dashboards and a Dashboard Builder add-on, our clients are more equipped than ever to tackle their retail challenges.
These Advanced Analytics are now available for current SimpliField platform users and new users that sign up today! Let’s dive into the new Analytics dashboards and how to make them work for you.
Upgraded Standard Dashboards
Understanding key metrics is essential for maintaining performance standards and hitting KPIs. How could anyone make informed decisions without knowing what’s going on? That’s why we launched our four essential dashboards.
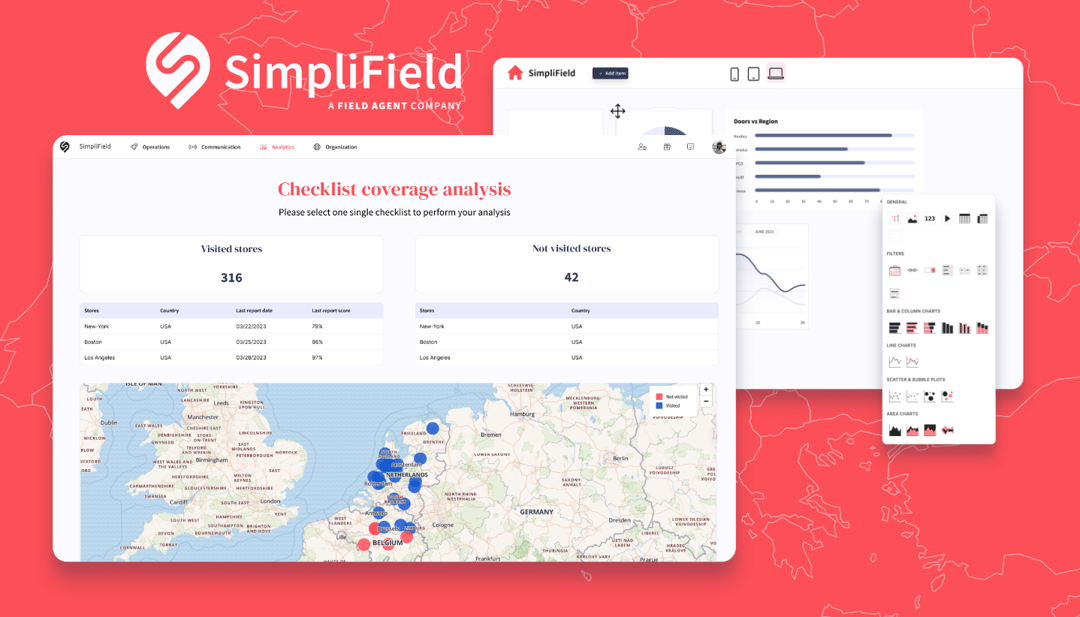
Store Checklist Coverage Dashboard
Now managers don’t have to feel overwhelmed with keeping track of consistent audits, they can easily analyze the coverage of visits across stores in any area. Leaders can track which stores are seeing the best compliance across regions, brands, teams, and more.
Team Performance Dashboard
Fix inconsistent team performance by understanding overall user responses, then drill down into the details for further diagnosis. Boost accountability by inspecting which team members are most engaged across specific teams, stores, or checklists. Identify and close the gaps across your team in real-time.
Store Performance Dashboard
Dive into individual store insights. Don’t let any stores slip through the cracks! Determine which stores need help or attention vs. which are excelling by assessing store-level scores over different timeframes. Plus, managers can follow-up on performance report levels and plan actionable follow-ups with qualitative analysis.
Reports & Action Plan Dashboard
Leaders won’t need to wonder what is driving a trend behind a particular region or group of stores: they are now able to look at the underlying drivers and assigned tasks. View the status, see trends, and manage scores of report submissions. Unlock rich quantitative and qualitative insights from your checklist reporting.
Build Your Own Dashboard (Add-On)
Get a customized view of your business with SimpliField’s cutting-edge Dashboard Builder. This add-on feature allows admins to build personalized dashboards with retail analytics (the data that matters most). Monitor and analyze trends in your organization like the share of shelves in stores, your contributor and store manager adoption, or the tying frontline operational tasks to business performance metrics (like NPS) using data from outside SimpliField.
We’ve outlined a few key use cases that you could leverage the Dashboard Builder.
Admin Monitoring
Managers may lack visibility into user activity—leading to a lack of accountability. Ensure all team members are adapting to SimpliField as expected by seeing regional usage (logins, reports created), checklist completion, and engagement metrics.
In-Store Insights
It’s evident that many brands struggle to glean meaningful insights like shelf share and competitive pricing trends over time. Make the most of your contributors’ responses and see the sum of their efforts by tracking in-store insights through this interactive dashboard module. Leaders can monitor shelf share information, track merchandising compliance, and keep an eye on competitive pricing trends.
Combining Useful Datasets
Fix data visibility issues and see a holistic picture of your business by combining data. For many, running a business requires outcomes data that’s often stored in centralized warehouses. It’s time to see the full scope of data by combining it all.
Get key visibility data in two ways: first, by regularly combining data from sources outside SimpliField for multiplied operational insights. Or, export data constructed from SimpliField to use elsewhere. (e.g. CSV, PNG, XLSX)
We’re Changing the Landscape of Retail Analytics
Thanks to your continued support, we are incredibly pleased to roll out SimpliField's New Advanced Analytics.
We have simplified data visualization, eliminated complexity, and empowered our customers with upgraded Standard Dashboards and the Dashboard Builder add-on. To fully harness the potential of these enhancements, we invite you to contact us for a demo.
Together, we can fully make informed decisions and thrive in the ever-evolving world of retail.